Each year, Cascades discloses non-financial information to report on its sustainability performance.
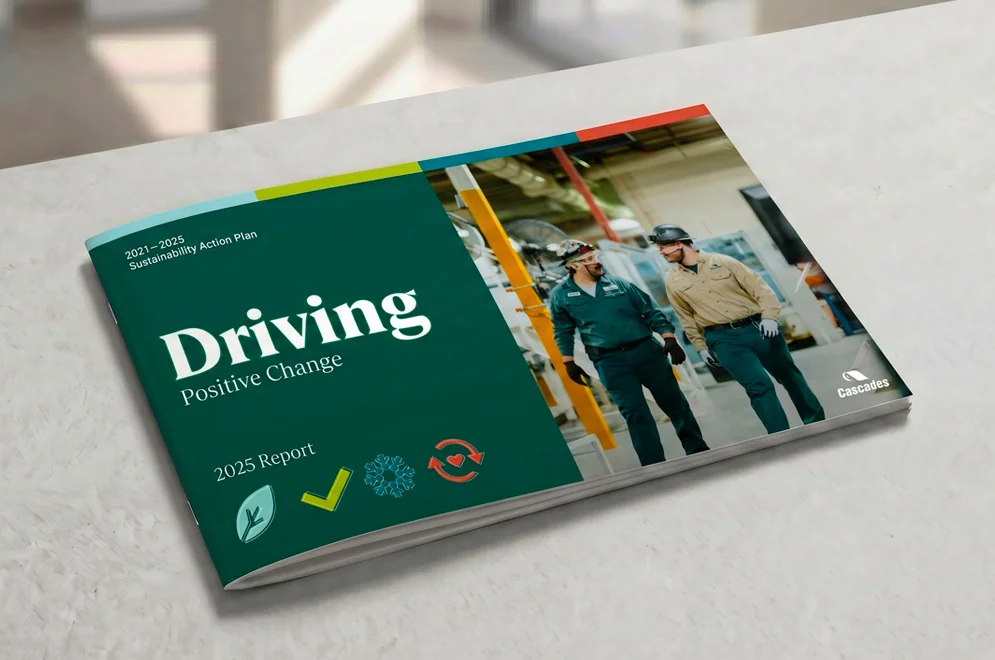
2025 Sustainability Report
Our 2025 report highlights the progress achieved and the concrete actions implemented to meet our sustainability commitments. It reflects our transparency and our commitment to continuous improvement, in collaboration with our stakeholders at every key stage.
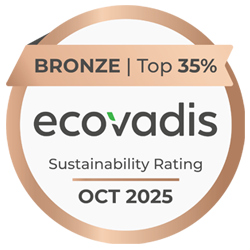
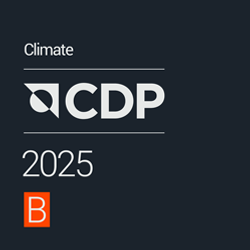
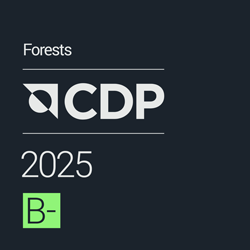
Our Sustainability Ratings
Our sustainability efforts are measured and recognized through several independent assessments.
2025 Reports

2025 Sustainability Report
View the report

2025 CDP Climate / Forest / Water Questionnaire
View the questionnaire
2024 Reports

2024 Sustainability Report
View the report

2024 Climate Report
View the report
Previous Reports
ESG Data
 2022 SASB Report
ESG Reporting
(anglais seulement)
2025 CDP Corporate Questionnaire
2023 Climate Questionnaire
2023 Forest Questionnaire
Our sustainable DNA
For over 60 years, we have been creating a current of change together.
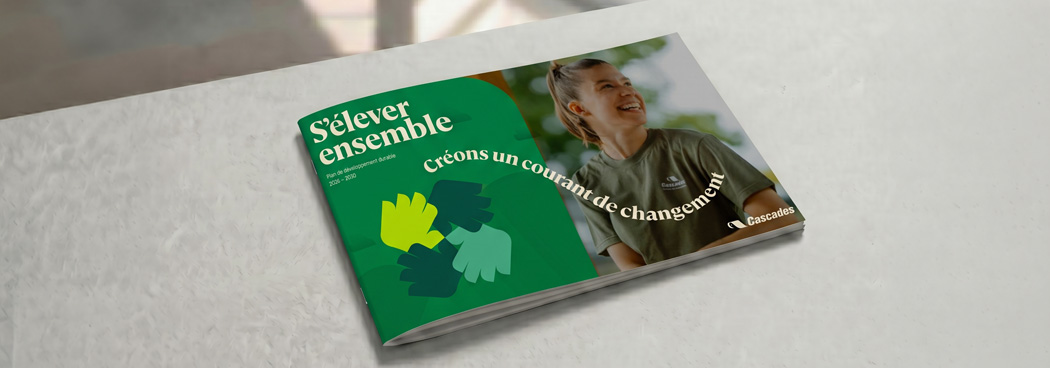
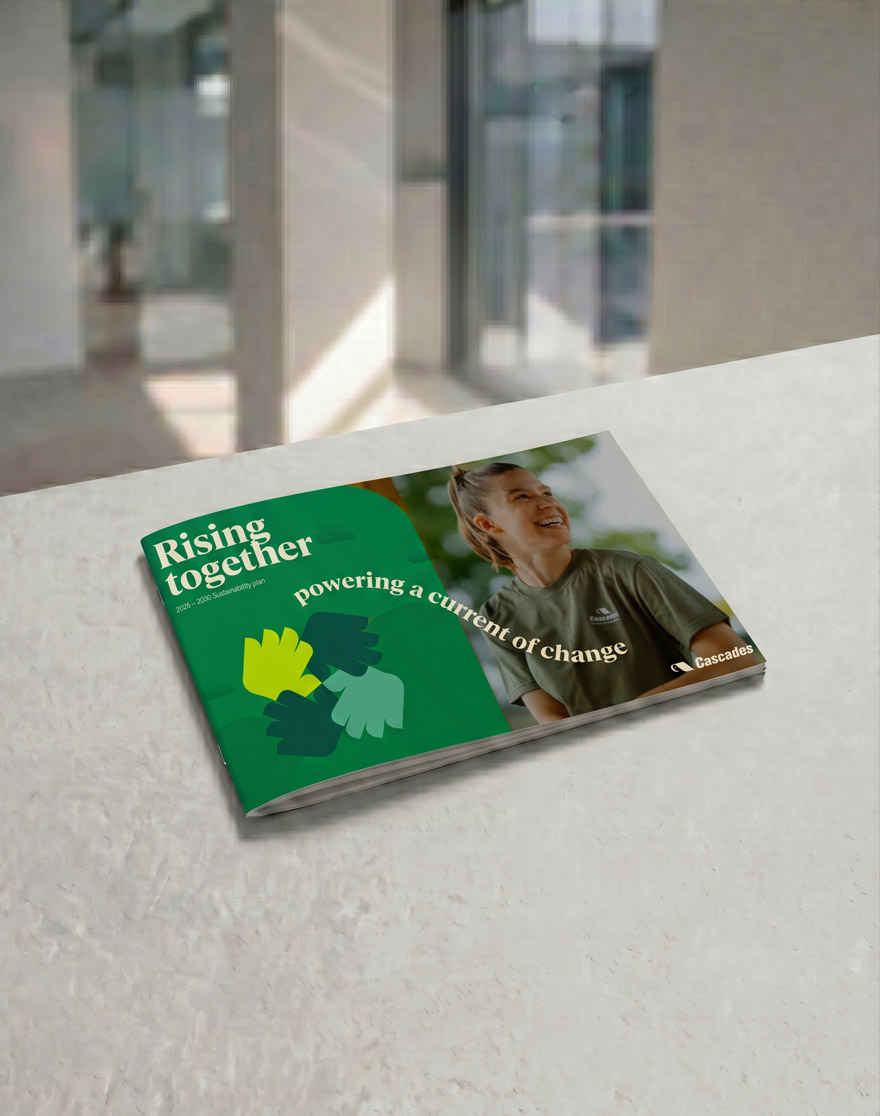
2026-2030 Sustainability Plan
A structured plan that guides our actions to reduce our footprint and that of our customers while enhancing our long-term positive impact.
Our Sustainability Approach
Cascades is committed to maximizing the potential of its partners while minimizing their impact.